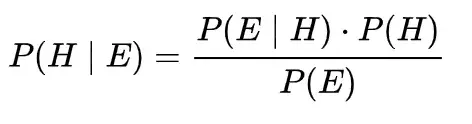
I hope you read our post on Bayesian Method – MCMC.
Probably you may see a mixed Poisson distribution on the number of COVID-19 cases reported during the past 16 days from 12-Apr-2020. As hinted in the Post there will be a mixed distribution From 1st Apr to 15 Apr as well.
- Perform change-point analysis using any technique without resorting to MCMC sampling.
- Use MCMC sampling to detect the change-point
Looking forward to your response.
Solution
The comprehensive approach at India-wide and TamilNadu-wide are illustrated here
https://github.com/krsmanian1972/bayes/blob/master/COVID19-Bayesian-Inference.ipynb
https://github.com/krsmanian1972/bayes/blob/master/TamilNadu-COVID19-Bayesian-Inference.pdf
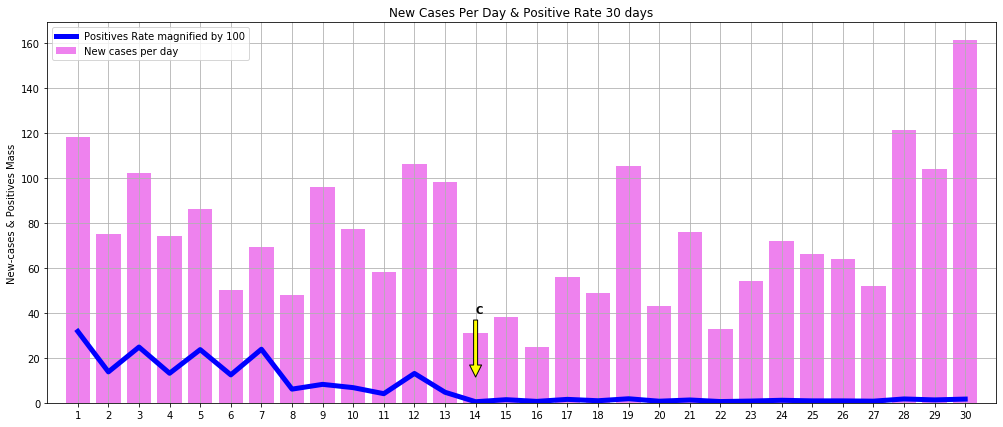
Please note that in Tamil Nadu at this time of I’m publishing this CHOW (2nd May) the number of new cases is three times that of 15 Apr, the growth is due to the increase in the number of tests per day.
Hence use this solution for Bayesian changepoint analysis of a mixture model
The relationship is, the probability – Count of positive tests by the number of samples tested per day.
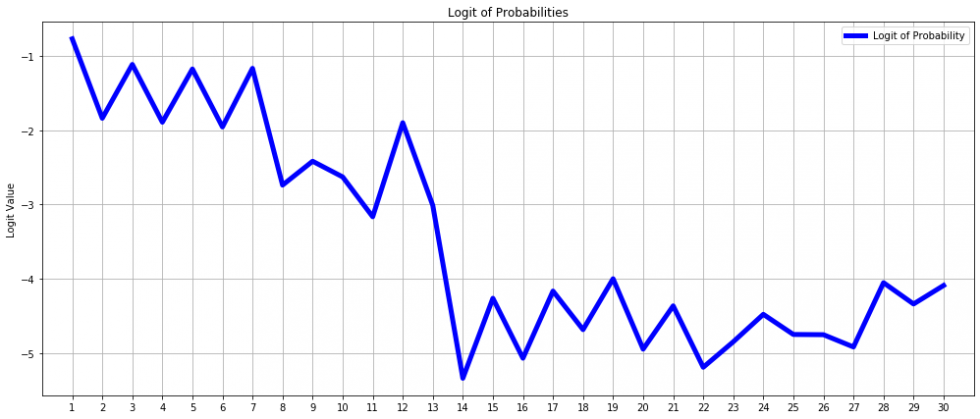
The Logit distribution of the ratio for your visualization and future inferences:
Soon we will provide the beta distribution to infer the probability of new cases for a range of samples to be tested
Thanks