
Teams and organizations like things to be deterministic. Start with a plan – a projection – and make sure you achieve the goals. Based on oft quoted phrase ‘you cannot manage what you cannot measure’, the next step is to make everything measurable. The goals in terms of quantity, timeline — and of course quality.
As one gets into more details of execution, the number of parameters one may need to watch could become much more than higher level goals. In such a scenario, while the goals of a business unit head may be just revenue [more topline focus], a delivery manager might have a bottomline focus as well – to ensure profitability.
Cascading further down to a project manager or team member, quality goals also become important and in that process, the connect to higher order goals may be lost – or at least not be explicit.
In my experience with Business and Organizational excellence assessments, some of the most frequently asked questions are relating to metrics.
- how many metrics should I track
- what are some good metrics that are benchmarks
- should I automate collection of metrics
- how do you make people collect or track metrics
- and so on..
In most cases, my response starts with another question: Why do you want metrics?
the answers vary from:
- how else would I know that the teams are making progress — to
- how else can I benchmark
I see some basic conceptual gaps in such questions, as the core purpose of metrics is lost.
Any metric [I am using it interchangeably with measures] needs to follow the objectives set. So, they need to be in context. The context could be that of an organization or a project or a team within the project.
They can then indicate the progress or the impact on plans.
In order to be most useful, the metrics need to be useful for those that actually create them. For instance, a code quality indicator should be useful for the persons working closest to the code – architects, designers, developers, testers etc. Since each one has a slightly different view of code, they need to have the metrics that would help them course correct steadily.
That brings us to the question of whether these should be leading or lagging indicators. To move from corrective to preventive [or proactive] actions, the indicators need to be leading. In some cases, leading indicators are sensed and not necessarily ‘measured’ in numeric quantities.
One simple framework to manage metrics is to align them with the cascading objectives and include them as part of the way various roles discharge their responsibilities.
This helps with the views at different levels based on the same, single truth of data!
In our search for system that con ‘control’ by measuring, we many time make simple things complicated.
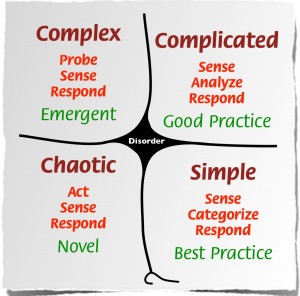
The Cynefin framework is a good way to understand the current state of an organization’s systems. When things are simple, it is possible to write standard operating procedure and also measure the performance of those processes.
But, many times, we tend to make things more complicated and unnecessarily complex.
Getting back to my experience with assessments of organizational excellence, I want to share what I had seen in two different organizations.
Organization 1: the process team was so thrilled to share their Quality Management System and how they have detailed specifications for almost every task that any roles is expected to perform.
And of course, process and product measures for each of those.
The total added up to about 2500!
The explanation was that for any person performing a task, it was not more than 12-15 items to track as metrics, so not a management nightmare.
The process team would then analyze all the data and identify projects for improving the performance. They were also very happy that many of those projects resulted in adding newer, more granular metrics.
While interacting with the teams, most of them could not relate to some of the metrics that are asked to report on, but were doing it, as it was part of the organizational quality system.
Compare this with organization 2:
This was also of similar size, similar industry [manufacturing, though they were into different products].
They defined 3 categories of measures: output, outcome and input.
Output measures were almost instant, while outcome measures in some cases were to be measured over time [such as the effectiveness of a change in design on market share as observed over a quarter]. The input measures were also used for planning [and budgeting].
As the strategic and operational objectives were cascaded down, it was easier to identify individual contribution goals [for departments as well as individuals] as well as collaborative contributions, with a focus on the outcome being shared.
This promoted the following behaviors:
– individually, every role had control over refining the processes to ensure that outputs are achieved based on optimizing inputs [efficiency as well as process productivity]
– and with shared outcomes, necessitated conversations and collaboration across functions and roles
the process team was a lean team that was providing a guidance role, since the individuals and teams used to ‘pull’ them for help to improve.
One of the departments had set a goal of 5% improvement per quarter over their performance in the previous quarter! This could be in any of the three parameters. Cost reduction [input], efficiency / productivity improvement [output] and change [improved CSAT, reduced field defects etc] in outcome parameters
What model do you follow?
Please share your experience with metrics to make this conversation richer.